For most use cases of powergrid, you will not need this function, but rather
use more convenient functions, most notable Example. Example
shows you the smallest sample size to still find enough power, or the
largest standard deviation at which your CI95 does not get too large. More
insight about the relation between parameters and the resulting power may be
gained with PowerPlot or GridPlot.
Only if you need to work with, say, the required n for a range of assumptions over and above PowerPlot and GridPlot, you will need to use FindTarget.
FindTarget takes as input an array (typically of class power_array).
FindTarget then searches (up or down) along one chosen dimension for a value
that meets a set target value (at least or at most). It does so for each
combination of the remaining dimensions. Concretely, this may mean: The
array contains the calculated power for each combination of dimensions n,
effect size, and SD. The function may then find, for each combination of
effect size and SD, the lowest n for which power of at least, say, .8 is
achieved. The result would be an array of effect size by SD, containing the
n's yielding acceptable power.
Usage
FindTarget(
  x,
  par_to_search = "n",
  find_lowest = TRUE,
  target_value = 0.9,
  target_at_least = TRUE,
  method = "step"
)
Arguments
- x
An array, most commonly of class
power_array, possibly the result of taking a slice of an object of classpower_arrayusingArraySliceror the power_array []-indexing method.- par_to_search
Which parameter should be searched to achieve the required target value. In the typical power analysis case, this is n.
- find_lowest
If TRUE, the lowest value of par_to_search is found that yields a value that meets the target. This is typical for n in a sample size estimation, where one searches the lowest n to achieve a certain power. For, e.g. the variance, one would however search for the maximum where the target power can still be achieved.
- target_value
The required value in x (e.g., .9, if the values represent power)
- target_at_least
Is the
target_valuea minimum (e.g., the power) or a maximum (e.g., the size of a confidence interval)- method
How is the required
par_to_searchto achievetarget_valuefound. Either'step': walking in steps alongpar_to_searchor'lm': Interpolating assuming a linear relation betweenpar_to_searchand(qnorm(x) + qnorm(1 - 0.05)) ^ 2. Setting 'lm' is inspired on the implementation in the sse package by Thomas Fabbro.
Value
Returns an array or vector: containing the value that is found for the par_to_search (say, n) meeting the target following above criteria (say, the lowest n for which the power is larger than .9), for each crossing of the levels of the other dimensions (say, delta, SD).
Details
By default FindTarget searches along the dimension called n
(par_to_search), searching for the lowest value (find_lowest
= TRUE) where the array contains a value of at least
(target_at_least = TRUE) .9 (the target_value), thus finding the
minimal sample size required to achieve a power of 90%. These arguments
may seem a bit confusing at first, but they allow for three additional
purposes:
First, the implementation also allows to search for a value that is at
most the target_value, by setting target_at_least to FALSE. This may
be used, for example, when the aim is to find a sample size yielding a
confidence interval that is not bigger than some maximum width.
Second, the implementation allows to search along another named dimension of x than n.
Third, the implementation allows to search for a certain target value to be achieved by maximizing (find_lowest = FALSE) the parameter on the searched dimension. This may be used, for example, when the aim is to find the maximum standard deviation at which a study's power is still acceptable.
FindTarget is most often called as the workhorse of
Example, PowerPlot or GridPlot.
Examples
## ============================================
## A basic power analysis example:
## ============================================
sse_pars = list(
n = seq(from = 10, to = 60, by = 2),
sig_level = seq(.01, .1, .01),
delta = seq(from = 0.5, to = 1.5, by = 0.2), ## effect size
sd = seq(.1, .9, .2)) ## Standard deviation
PowFun <- function(n, sig_level, delta, sd){
ptt = power.t.test(n = n/2, delta = delta, sd = sd,
sig.level = sig_level)
return(ptt$power)
}
power_array = PowerGrid(pars = sse_pars, fun = PowFun, n_iter = NA)
summary(power_array) # four dimensions
#> Object of class: power_array
#>
#> Range of values: [0.03, 1]
#> Evaluated at:
#> n 10, 12, 14, 16, 18, 20, 22, 24, 26, 28, 30, 32,
#> n 34, 36, 38, 40, 42, 44, 46, 48, 50, 52, 54, 56,
#> n 58, 60
#> sig_level 0.01, 0.02, 0.03, 0.04, 0.05, 0.06, 0.07, 0.08,
#> sig_level 0.09, 0.1
#> delta 0.5, 0.7, 0.9, 1.1, 1.3, 1.5
#> sd 0.1, 0.3, 0.5, 0.7, 0.9
## We can use Example so find the required sample size, but only for one example:
Example(power_array,
example = list(delta = .7, sd = .7, sig_level = .05),
target_value = .9)
#> ================================================
#> To achieve the target value of at most 0.9 assuming
#> delta = 0.7
#> sd = 0.7
#> sig_level = 0.05,
#> the minimal required n = 46
#> ------------------------------------------------
#> Description: Method "step" was used to find the
#> lowest n in the searched grid that yields a
#> target_value (typically power) of at least 0.9.
#> ================================================
## If we want to see the required sample size for all delta's, we can use
## FindTarget. Get the minimal n needed for achieving a value of 0.9, at sd =
## .3:
n_by_delta_sd_03 = FindTarget(power_array[, sig_level = '0.05', , sd = '0.3'],
par_to_search = 'n',
target_value = .9)
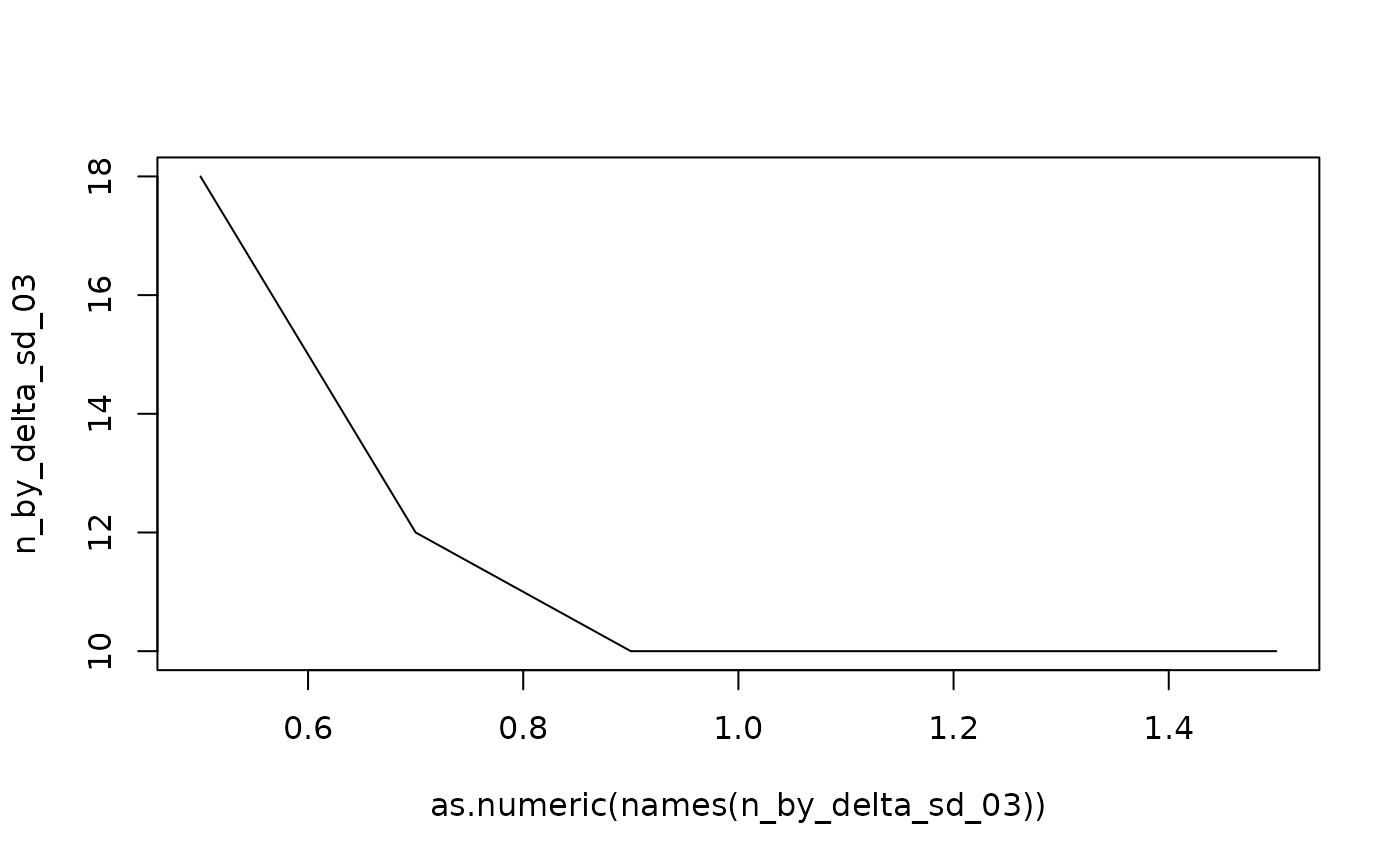
n_by_delta_sd_03
#> 0.5 0.7 0.9 1.1 1.3 1.5
#> 18 12 10 10 10 10
## just as an illustration, a figure (that can be much more aestetically made
## using PowerPlot)
plot(as.numeric(names(n_by_delta_sd_03)),
n_by_delta_sd_03, type = 'l')
 ## =================================
## Higher dimensionality
## =================================
## The function works also for higher dimensionality:
n_by_delta_sd = FindTarget(power_array,
par_to_search = 'n',
target_value = .85)
## what is the minimum n to achieve .85 for different values of delta, sd,
## when sig_level = 0.05:
n_by_delta_sd[5, , ] # note that for some combinations of delta and sd, there is
#> sd
#> delta 0.1 0.3 0.5 0.7 0.9
#> 0.5 10 16 38 NA NA
#> 0.7 10 10 22 38 NA
#> 0.9 10 10 14 24 38
#> 1.1 10 10 10 18 28
#> 1.3 10 10 10 14 20
#> 1.5 10 10 10 12 16
# no n yielding the required power at this significance
# level (NAs).
## =================================
## Higher dimensionality
## =================================
## The function works also for higher dimensionality:
n_by_delta_sd = FindTarget(power_array,
par_to_search = 'n',
target_value = .85)
## what is the minimum n to achieve .85 for different values of delta, sd,
## when sig_level = 0.05:
n_by_delta_sd[5, , ] # note that for some combinations of delta and sd, there is
#> sd
#> delta 0.1 0.3 0.5 0.7 0.9
#> 0.5 10 16 38 NA NA
#> 0.7 10 10 22 38 NA
#> 0.9 10 10 14 24 38
#> 1.1 10 10 10 18 28
#> 1.3 10 10 10 14 20
#> 1.5 10 10 10 12 16
# no n yielding the required power at this significance
# level (NAs).